Mapping SDOH in Wake County: Webinar Available Online

In communities across the nation, leaders in public health are increasingly interested in exploring upstream factors related to where people live, work and play and how these factors can affect health outcomes. Achieving population health goals often requires multi-sector partnering approaches and systems solutions. As communities begin to embrace a Social Determinants of Health (SDOH) perspective to tackle emerging and consistent challenges, many are finding it helpful to have neighborhood level data to inform strategies. Solutions are emerging from communities themselves, solutions that often are from an assets-based approach.
Engaging in the local conversation
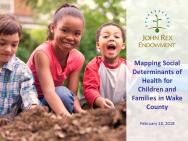
In 2017, the John Rex Endowment commissioned the North Carolina Institute for Public Health (NCIPH) to conduct an Assessment and create an online Story Map to describe how social, economic and environmental conditions in Wake County can affect children and their families’ health and well-being. This wealth of information is available and we would like to maximize its use throughout our county. We are pleased to share the slides and the recorded 90-minute webinar "Mapping SDOH for Children and Families in Wake County" where viewers (1) learn the 12 key indicators mapped to geographically identify assets and areas with higher opportunity for improvements and (2) look at specific indicators across the county seeing which are of most significance in specific geographies.
As SDOH efforts evolve across U.S. communities, using care and caution in how we collectively communicate information and disseminate findings feels important. While working together to improve the health and well-being of children and families, the Story Map is one tool among many to help inform strategies, understanding that it is reflective of one point in time. The Assessment is a compilation of a series of interviews to provide additional context to the findings presented in the Story Map.
Q & A
Below are two questions raised during the webinar followed by a response from NCIPH.
- For education, you used school enrollment ages 3 -18. What is included since 3-year-olds are not in school? How did you account for home school? ANSWER: According to the U.S. Census, respondents to the American Community Survey are instructed to include individuals in school enrollment that are in “nursery or preschool, kindergarten, elementary school, home school, and schooling which leads to a high school diploma, or a college degree.” Additionally, “school enrollment is only recorded if the schooling advances a person toward an elementary school certificate, a high school diploma, or a college, university, or professional school (such as law or medicine) degree.”
- Why was WIC participation not included? ANSWER: We had several discussions as a group on whether or not to include the number of WIC participants by neighborhood or SNAP. We examined the geographic patterns and they were similar. We settled on SNAP as a proxy for WIC and other economic data as SNAP included all households with children under 18 receiving this subsidy whereas WIC eligibility ends at age 5. We also included access to high quality child care as a proxy for this age range.
It is our hope that the Assessment and interactive Story Map will serve as tools in organizational planning and programming.
- To access the Powerpoint slides used in the webinar
- To access the Story Map use either of the following: http://arcg.is/2pDFuXr or https://tinyurl.com/JRE
- For navigation tips including how to upload organizational data, read the "User Guide: Mapping Social Determinants of Health and Assets for Children and Families in Wake County - A Story Map".
- Read the Executive Summary of the Assessment "Exploring the Social Determinants of Health in Wake County"
- See the Assessment's themes, ten priorities, informing how conditions in the places where children and families live, work and play affect their health and well-being

